> ## Documentation Index
> Fetch the complete documentation index at: https://synthetiq.com/docs/llms.txt
> Use this file to discover all available pages before exploring further.
# Workflows Docs
> Auto-generated workflow reference with schedules, step DAGs, and interactive visualizations
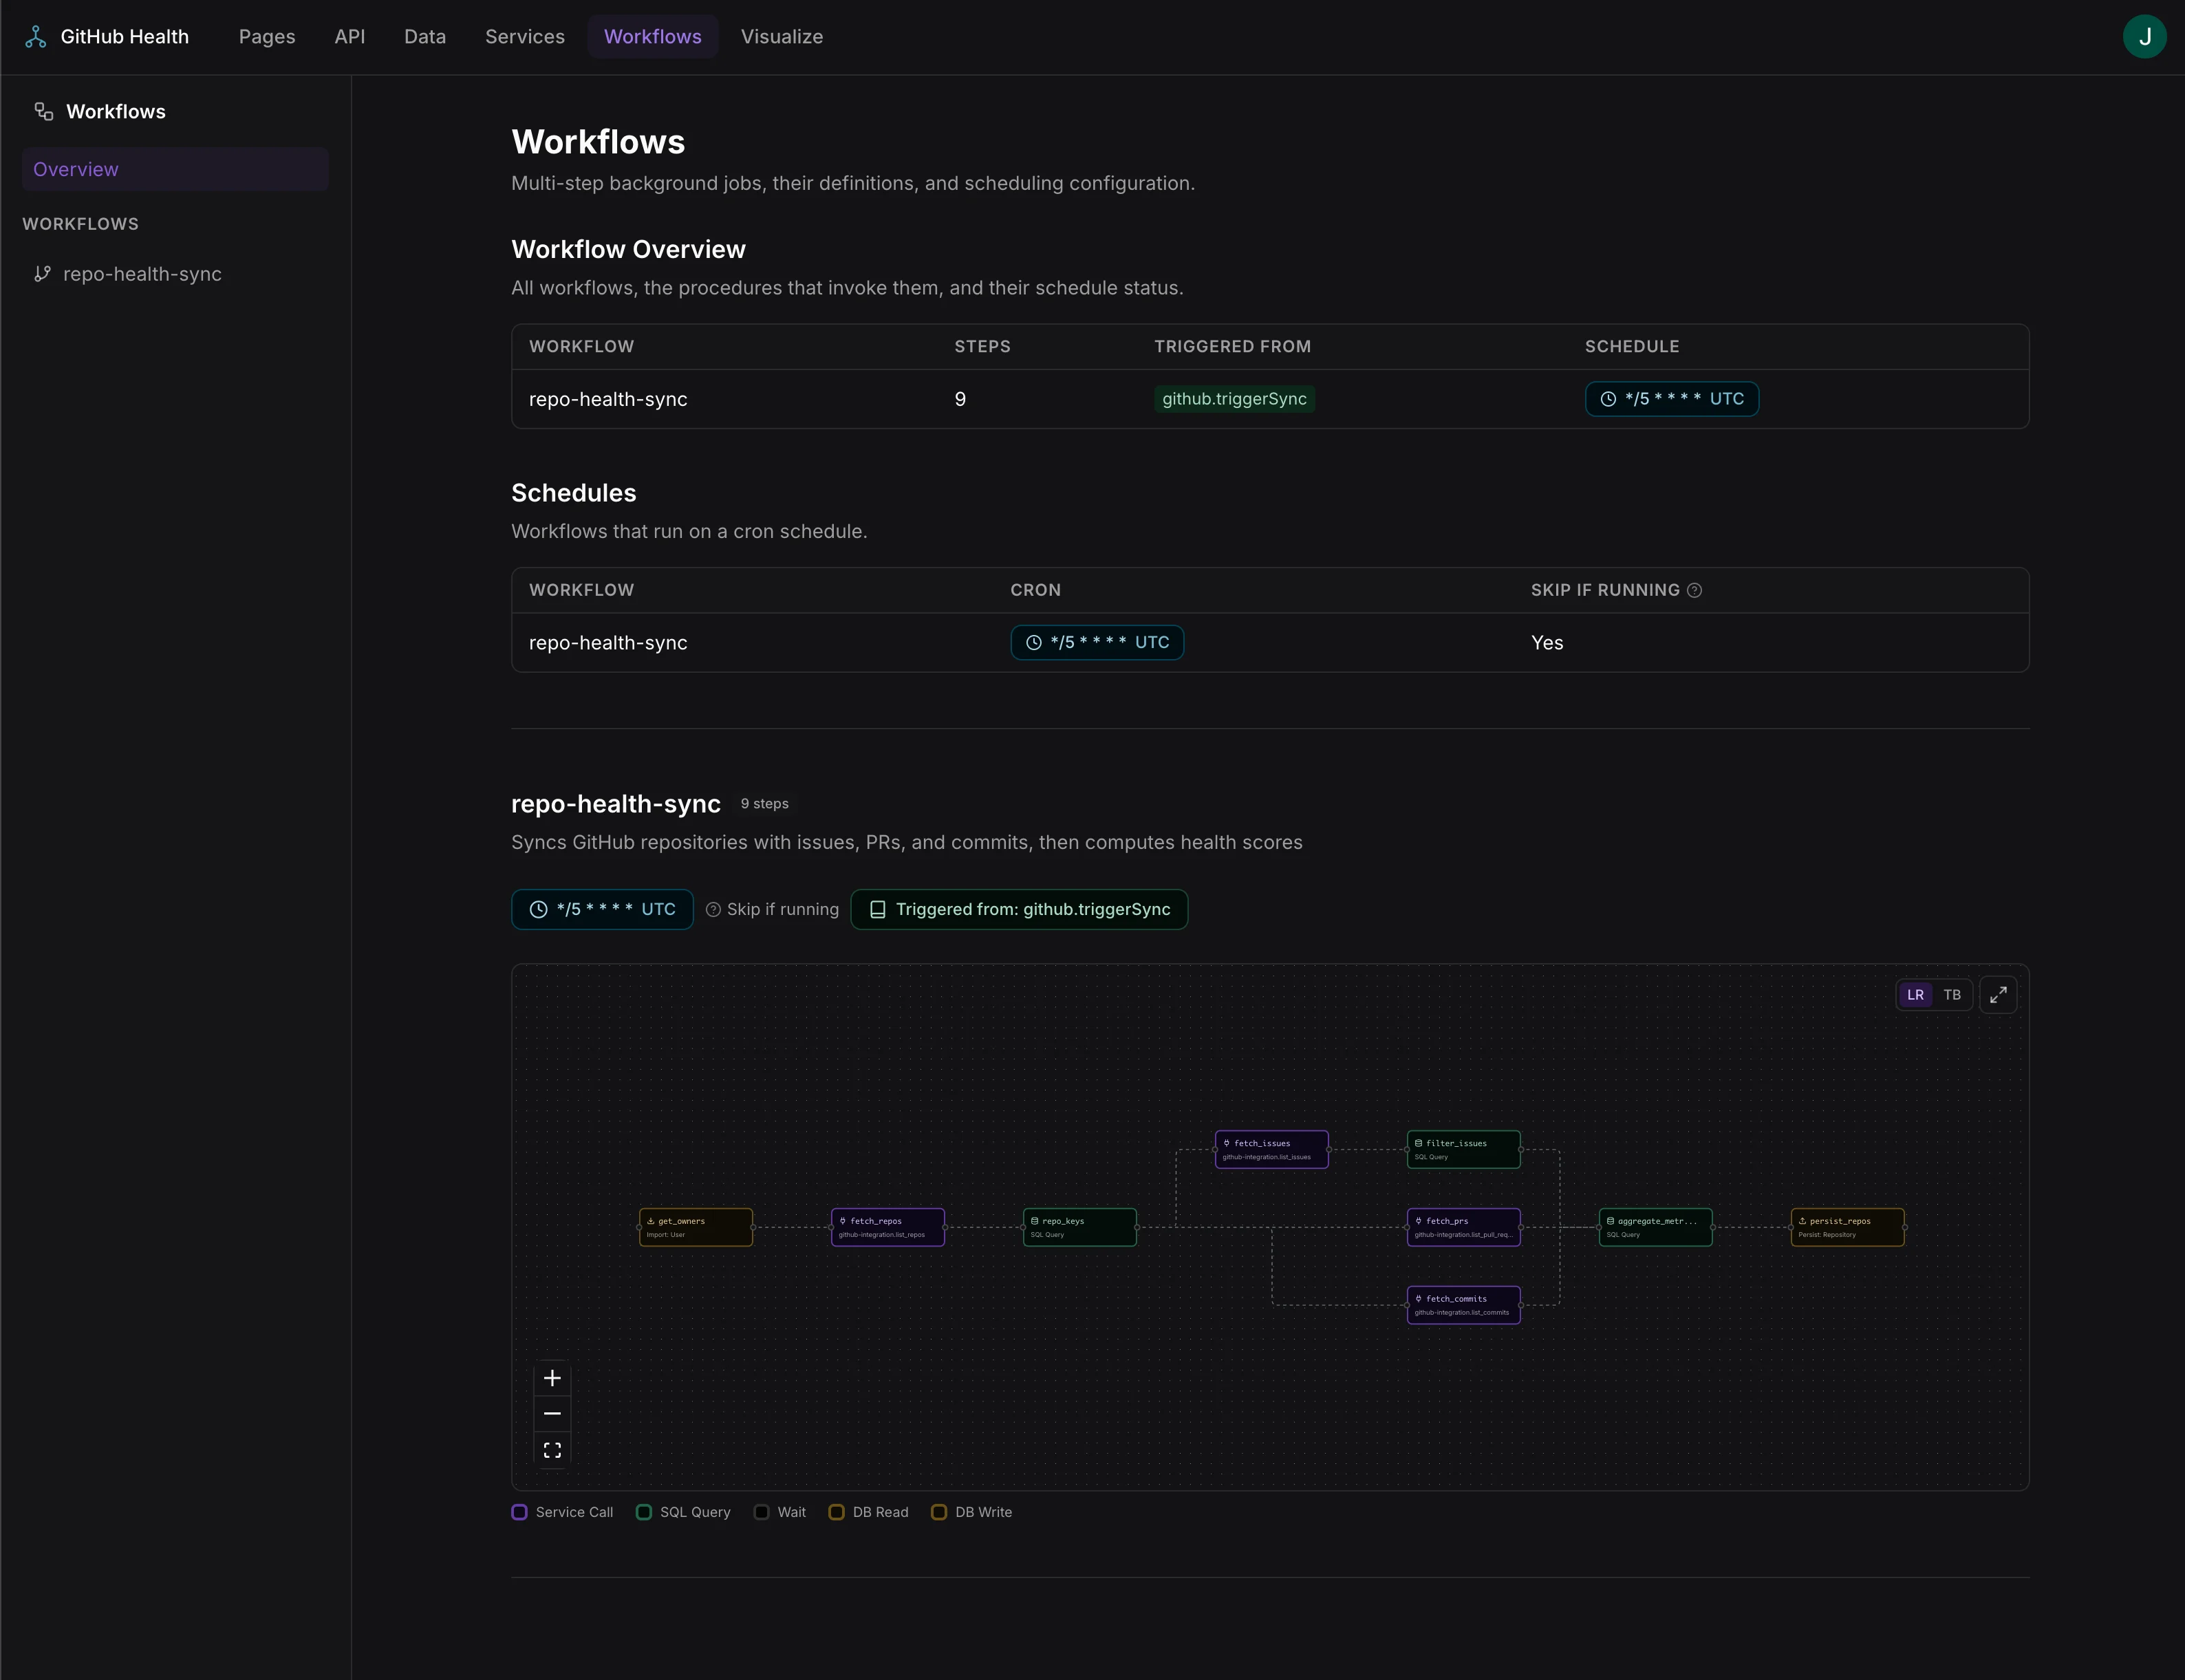
The Workflows docs page at `/docs/workflows` documents all workflow definitions, their scheduling configuration, and provides interactive DAG visualizations of each workflow's steps.
## Workflows overview
The overview lists every workflow with its step count, which procedures trigger it, and its cron schedule (with human-readable tooltips like "Daily at 2:00 AM"). A dedicated schedules table shows workflows that run on a cron schedule, with the cron expression, timezone, and whether overlapping runs are skipped.
 ## Workflow detail
Clicking a workflow scrolls to its detail view, which shows:
* **Name and description** — the workflow's display name and description
* **Step count** — badge showing the number of steps
* **Triggers** — linked badges for cron schedules and procedure triggers, with links to the API docs
* **Input variables** — the workflow's input parameters with names and types
* **Interactive DAG** — a visual graph of the workflow's steps
## Interactive DAG visualization
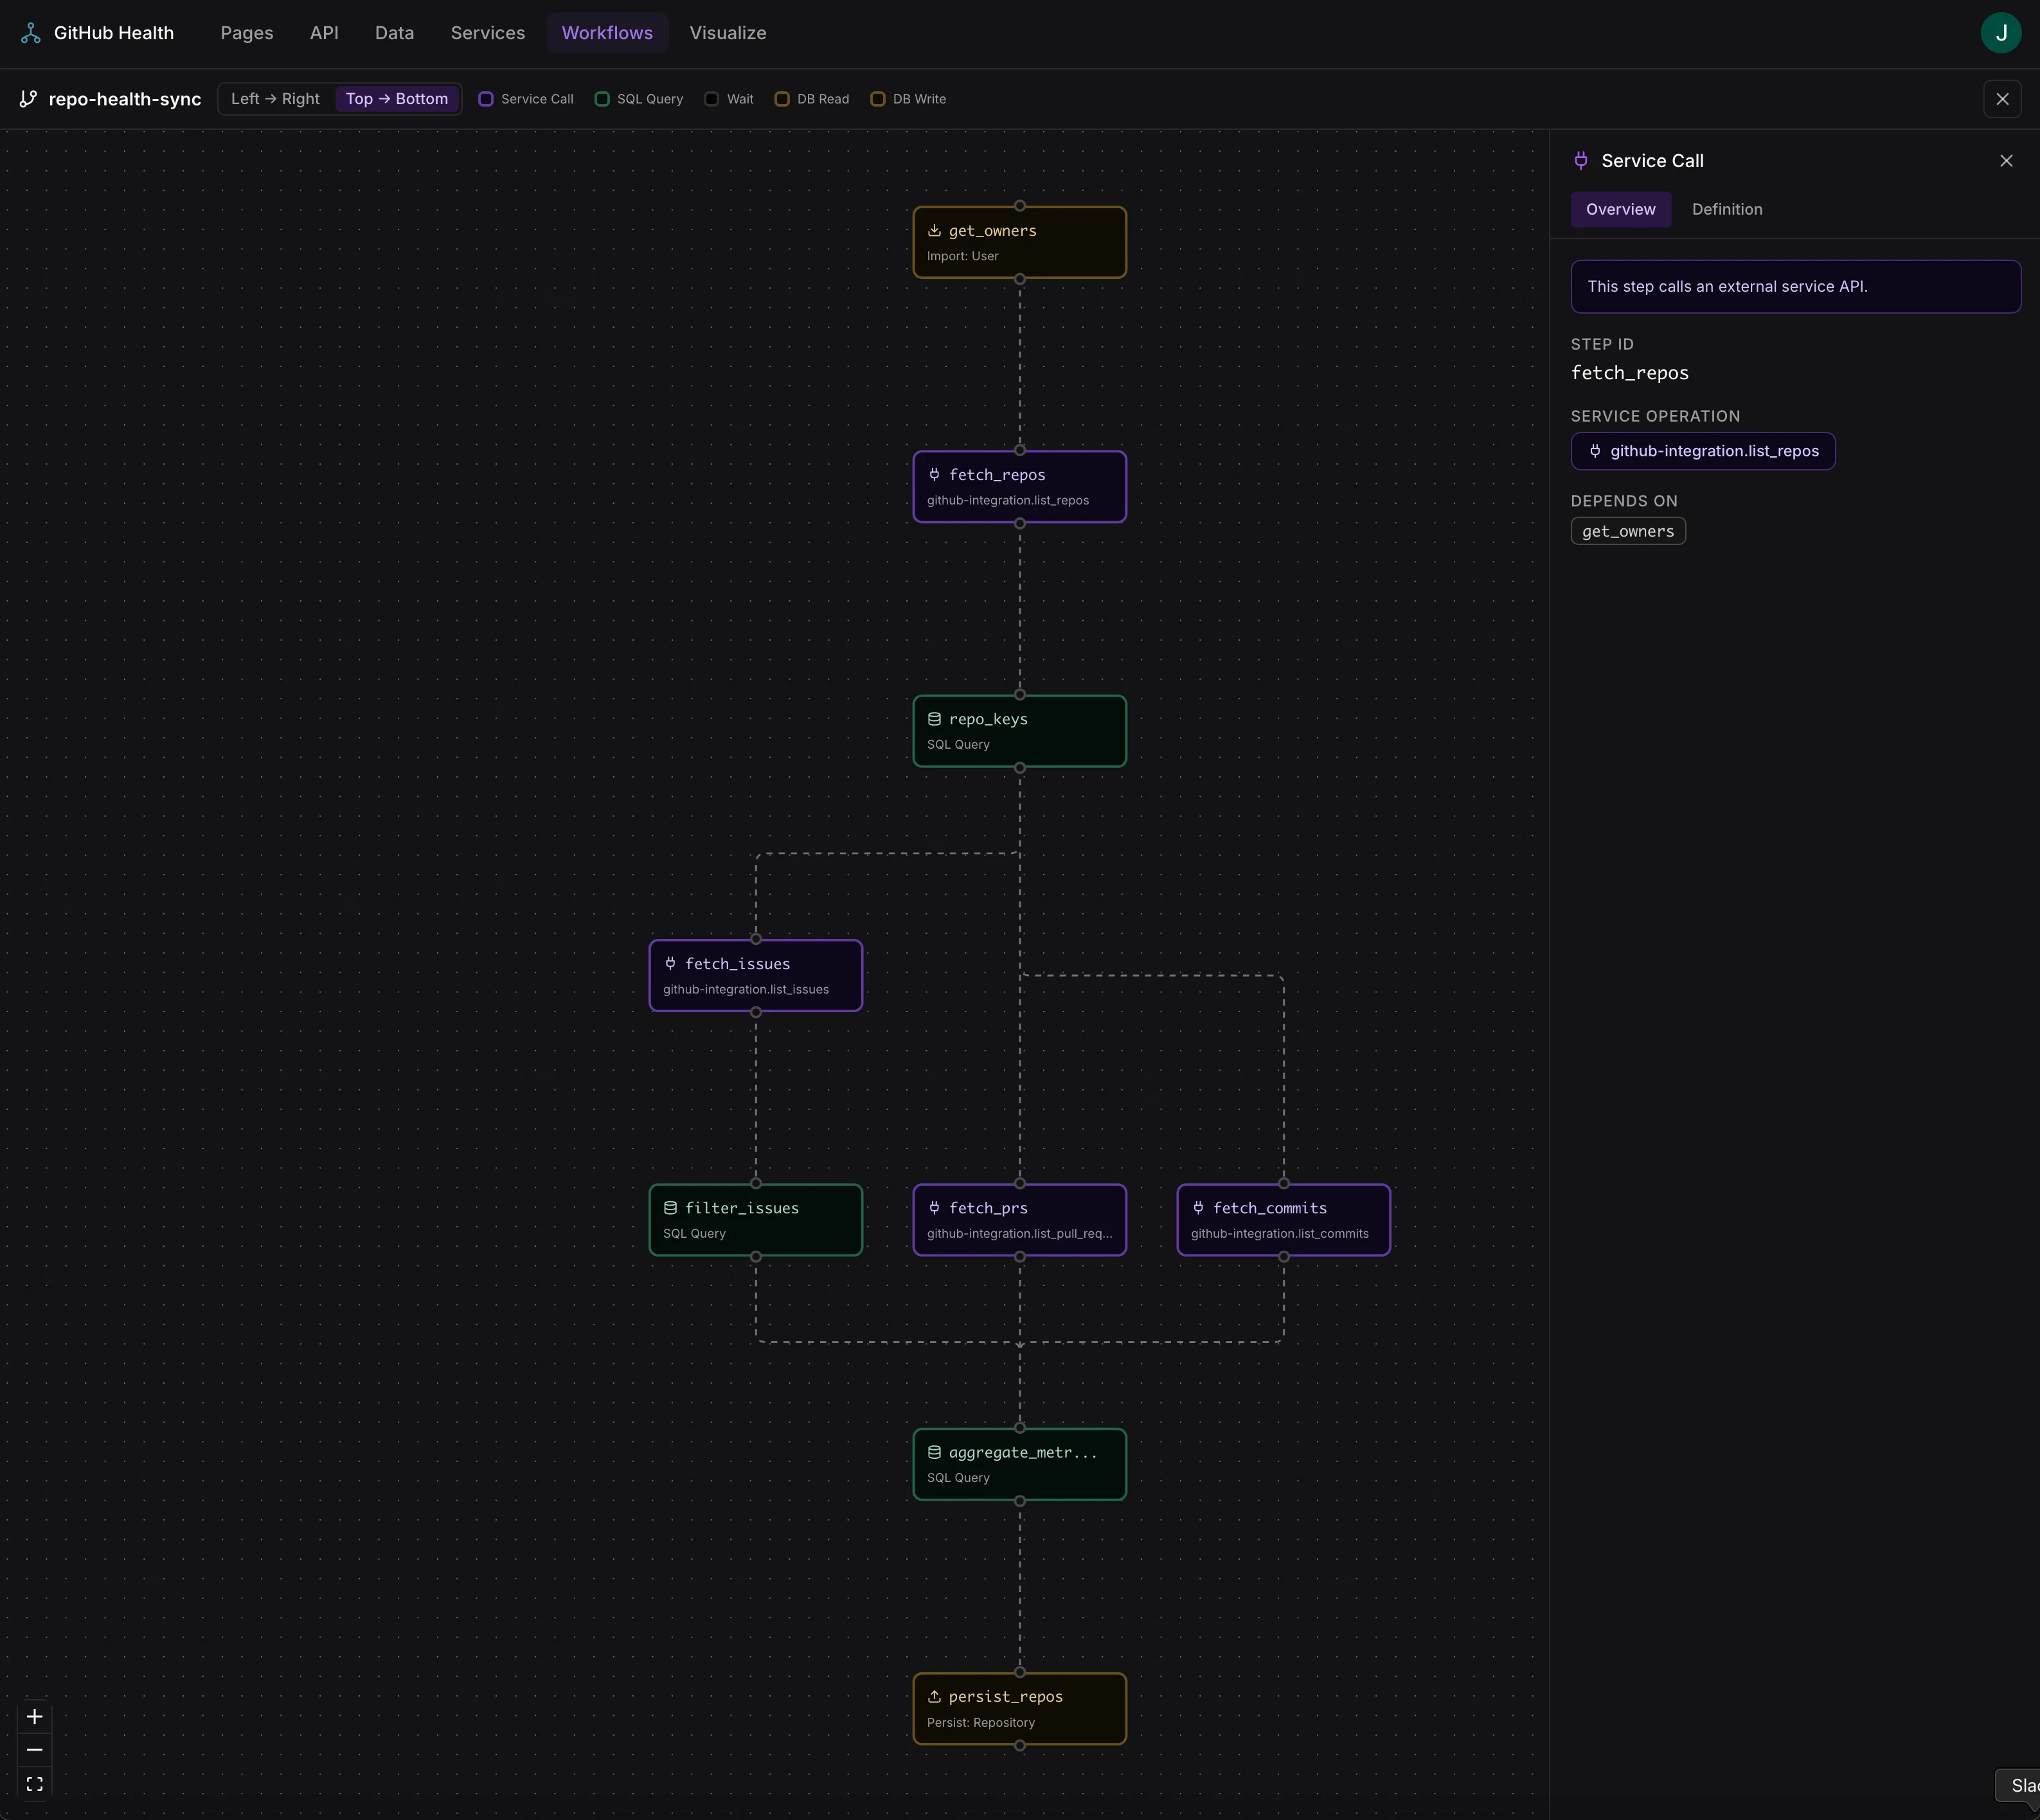
Each workflow includes an interactive directed acyclic graph (DAG) built with React Flow. The DAG supports:
* **Direction toggle** — switch between left-to-right and top-to-bottom layouts
* **Expand to fullscreen** — maximize the DAG for complex workflows
* **Click a step** — opens a details panel showing the step's configuration, service operation links, SQL queries, and dependencies
* **Click a branch edge** — shows the branch condition SQL and which step it gates
* **Input variables panel** — displays the workflow's input variables when expanded
* **Zoom and pan** — scroll to zoom, drag to pan
## Workflow detail
Clicking a workflow scrolls to its detail view, which shows:
* **Name and description** — the workflow's display name and description
* **Step count** — badge showing the number of steps
* **Triggers** — linked badges for cron schedules and procedure triggers, with links to the API docs
* **Input variables** — the workflow's input parameters with names and types
* **Interactive DAG** — a visual graph of the workflow's steps
## Interactive DAG visualization
Each workflow includes an interactive directed acyclic graph (DAG) built with React Flow. The DAG supports:
* **Direction toggle** — switch between left-to-right and top-to-bottom layouts
* **Expand to fullscreen** — maximize the DAG for complex workflows
* **Click a step** — opens a details panel showing the step's configuration, service operation links, SQL queries, and dependencies
* **Click a branch edge** — shows the branch condition SQL and which step it gates
* **Input variables panel** — displays the workflow's input variables when expanded
* **Zoom and pan** — scroll to zoom, drag to pan
 ## Generated from
This page is populated from the workflow manifest, which the build pipeline generates by analyzing workflow definitions in `src/server/workflows/` and schedule configurations in `schedules.json`.
## Generated from
This page is populated from the workflow manifest, which the build pipeline generates by analyzing workflow definitions in `src/server/workflows/` and schedule configurations in `schedules.json`.