> ## Documentation Index
> Fetch the complete documentation index at: https://synthetiq.com/docs/llms.txt
> Use this file to discover all available pages before exploring further.
# Logs
> Structured logging and log search for deployed Synthetiq apps
## Structured logging
All application logging uses structured JSON. Each log entry includes:
| Field | Description |
| --------- | ------------------------------------------------------------------ |
| `source` | `app` or `worker` |
| `type` | Event type (e.g., `http_request`, `service_call`, `workflow_step`) |
| `status` | HTTP status code |
| `ms` | Response latency in milliseconds |
| `userId` | Authenticated user ID (when applicable) |
| `traceId` | Request trace identifier |
| `error` | Error message (when applicable) |
Logs are isolated per app — each app writes to its own log stream.
Apps can also instrument custom log fields to capture application-specific data (see Custom Logging guide).
## Log search
A structured log search interface is available at:
```
https://{your-app-url}/admin/monitoring/logs
```
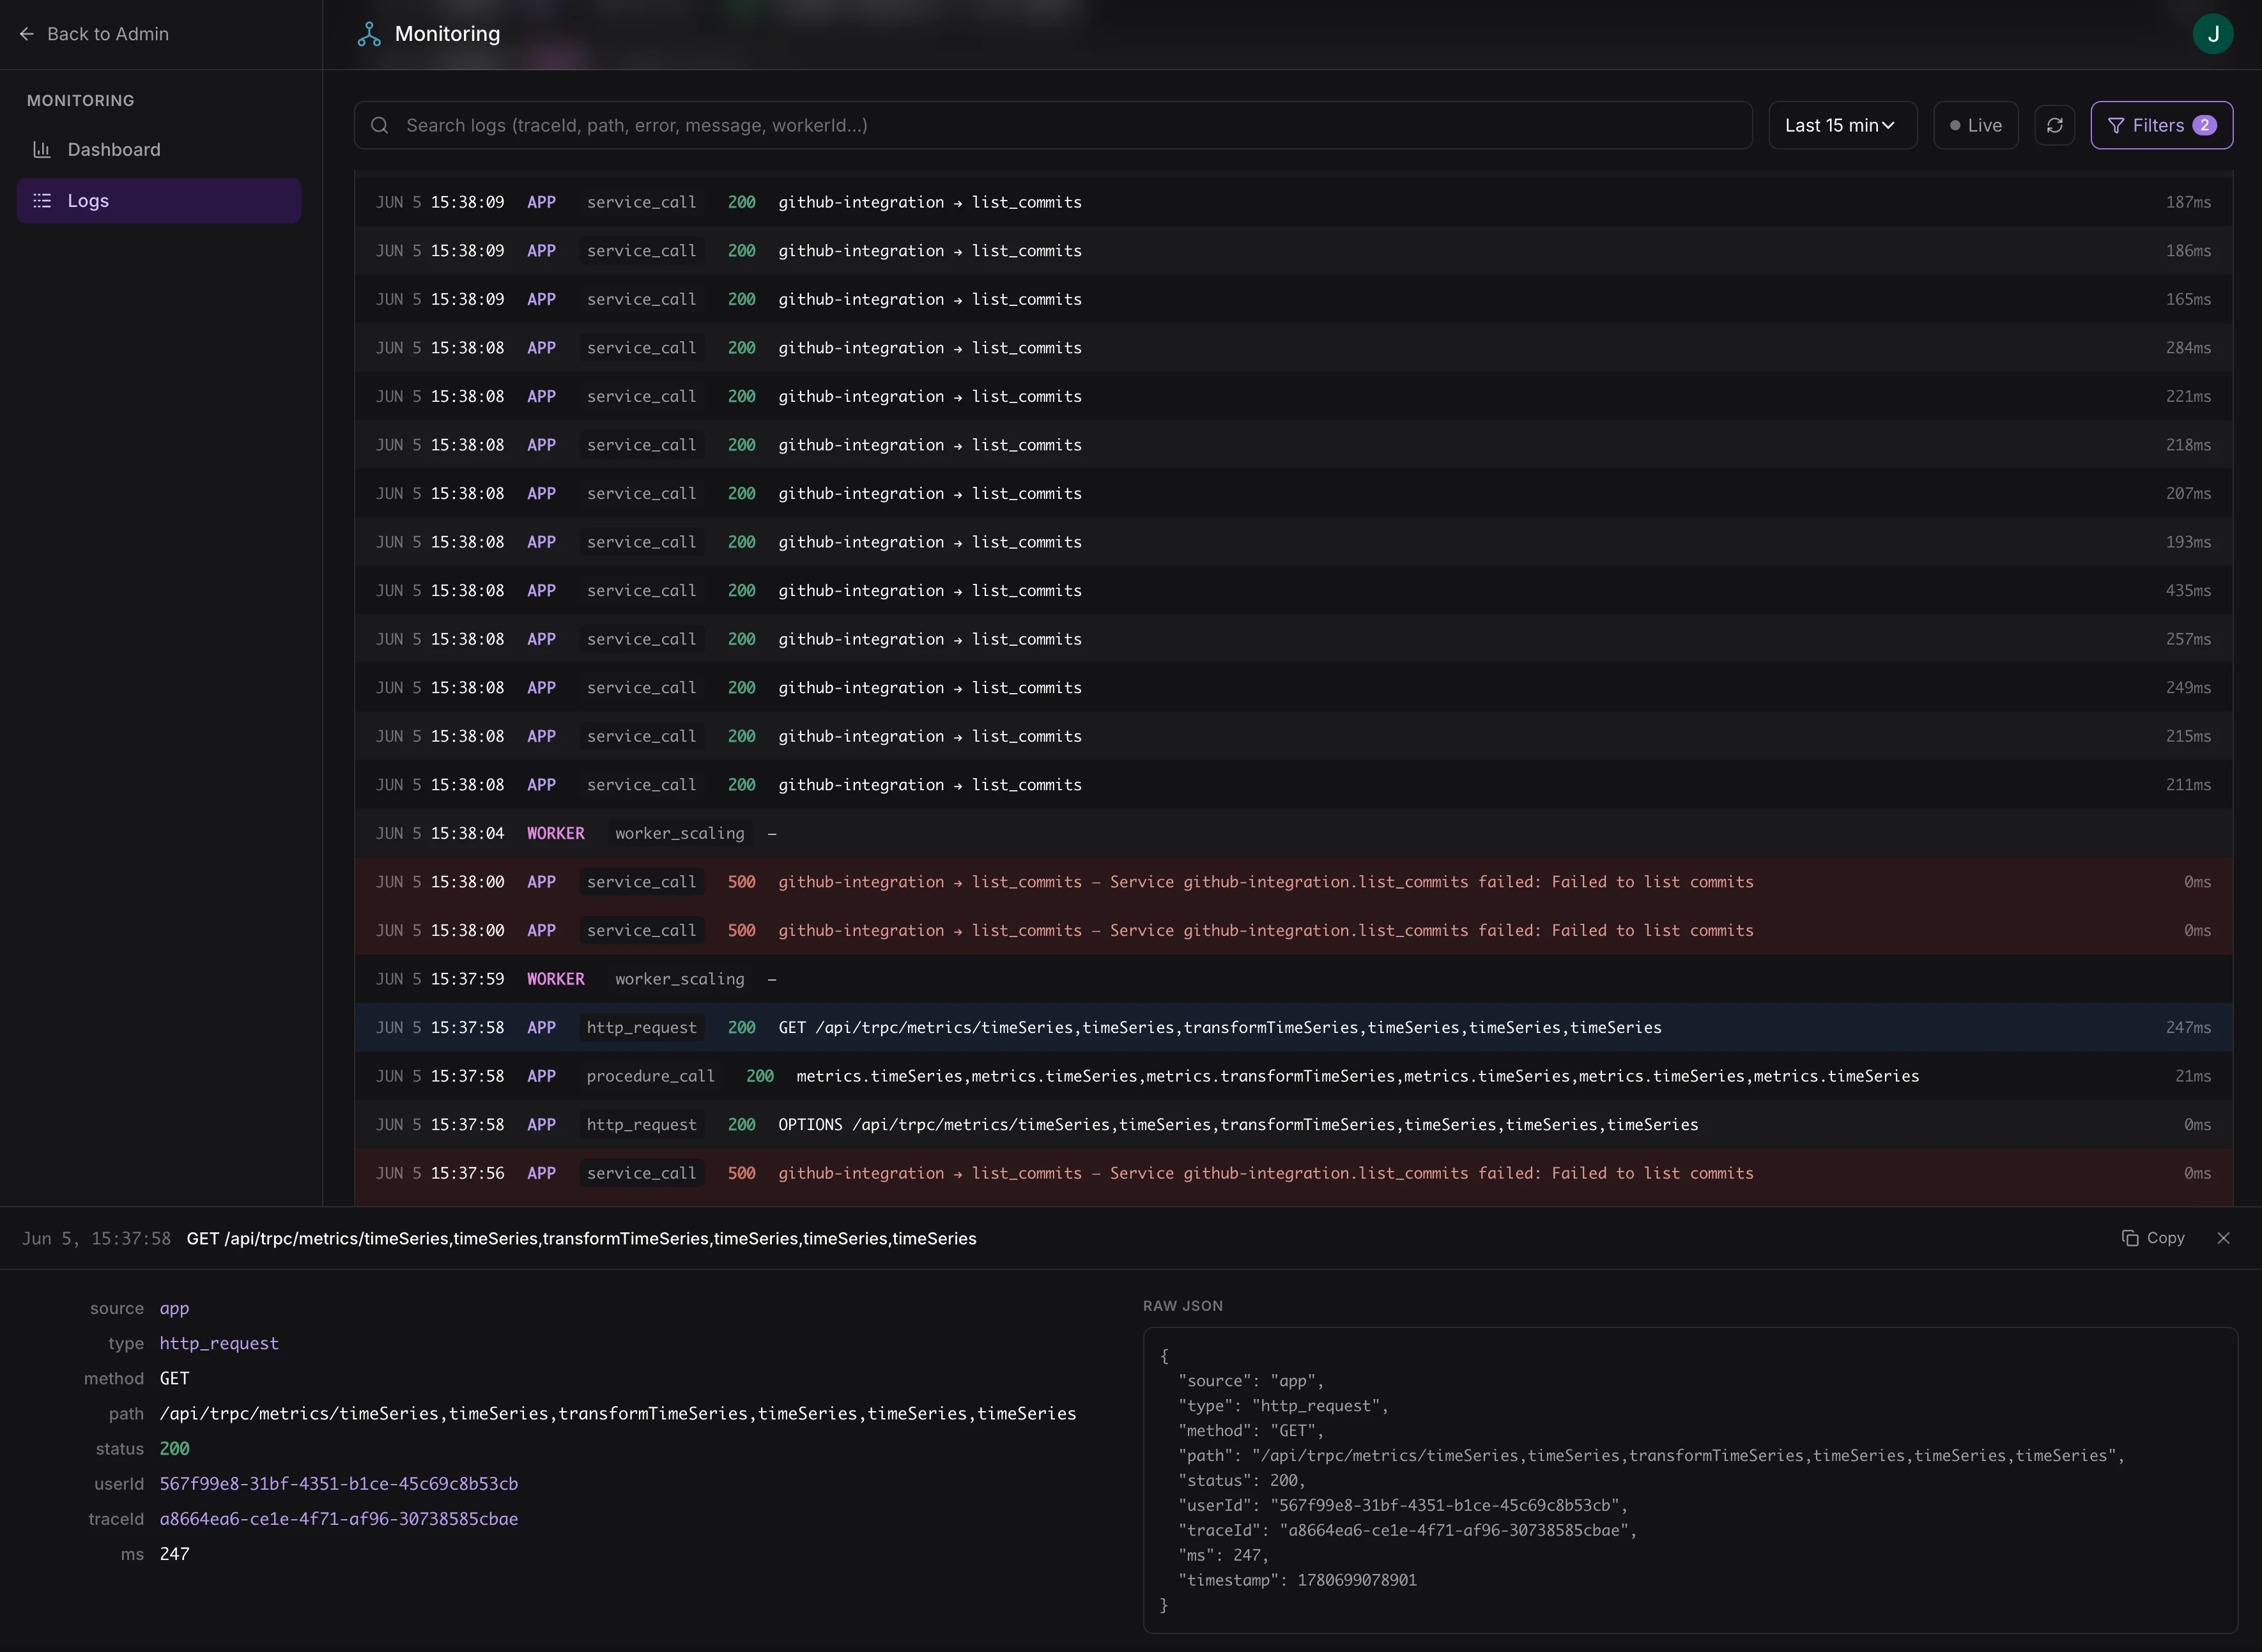 Access requires the `logs:view` scope. Assign this scope to admin roles in your app's access control configuration.
### Filter options
| Filter | Description |
| ---------------- | ----------------------------------------------------------- |
| Source | `app` (HTTP server) or `worker` (workflow processor) |
| Type | Request type, workflow step name, etc. |
| Status range | Filter by HTTP status code range (e.g., 500–599 for errors) |
| User ID | Filter to a specific user's activity |
| Trace ID | Follow a request across services |
| Full-text search | Search across all log entry fields |
| Time range | Custom start and end timestamps |
Logs are available in near-real-time, typically within a few seconds.
Access requires the `logs:view` scope. Assign this scope to admin roles in your app's access control configuration.
### Filter options
| Filter | Description |
| ---------------- | ----------------------------------------------------------- |
| Source | `app` (HTTP server) or `worker` (workflow processor) |
| Type | Request type, workflow step name, etc. |
| Status range | Filter by HTTP status code range (e.g., 500–599 for errors) |
| User ID | Filter to a specific user's activity |
| Trace ID | Follow a request across services |
| Full-text search | Search across all log entry fields |
| Time range | Custom start and end timestamps |
Logs are available in near-real-time, typically within a few seconds.