> ## Documentation Index
> Fetch the complete documentation index at: https://synthetiq.com/docs/llms.txt
> Use this file to discover all available pages before exploring further.
# Metrics
> Application, infrastructure, and custom metrics for deployed Synthetiq apps
## Application metrics
Apps automatically collect and publish the following metrics every 30 seconds:
| Metric | Description | Unit |
| ---------------- | ---------------------------------------- | ------------ |
| `RequestCount` | HTTP requests, service calls, page views | Count |
| `Latency` | Response time per request | Milliseconds |
| `WorkerDemand` | Pending + running workflow jobs | Count |
| `WorkerCapacity` | Total concurrency across active workers | Count |
Metrics are dimensioned by:
* **`type`**: HTTP Request, Service Call, Page View
* **`statusCategory`**: Success (2xx–3xx), Warning (4xx), Error (5xx)
This enables drill-down queries such as "error rate for HTTP requests" or "p95 latency for service calls."
Each app publishes to its own isolated metrics namespace — apps cannot access each other's metrics.
## Infrastructure metrics
In addition to application-level metrics, the following infrastructure metrics are collected by the cloud provider approximately every 60 seconds:
| Metric | Description |
| ---------------------- | ------------------------------------------------ |
| CPU Utilization | Average CPU usage across service instances |
| Memory Utilization | Average memory usage across service instances |
| Running Instance Count | Number of currently running instances |
| Desired Instance Count | Number of instances requested by the auto-scaler |
## Custom metrics
Apps can be instrumented with custom metrics to track application-specific data (see Custom Metrics guide). Custom metrics are published in the same manner as application metrics — collected every 30 seconds and isolated per app.
## Database metrics
Database metrics are coming soon. In the interim, BYOI users can monitor database metrics directly through their cloud provider's native tools.
## Metrics dashboard
Each app ships with a metrics dashboard accessible at:
```
https://{your-app-url}/admin/monitoring/dashboard
```
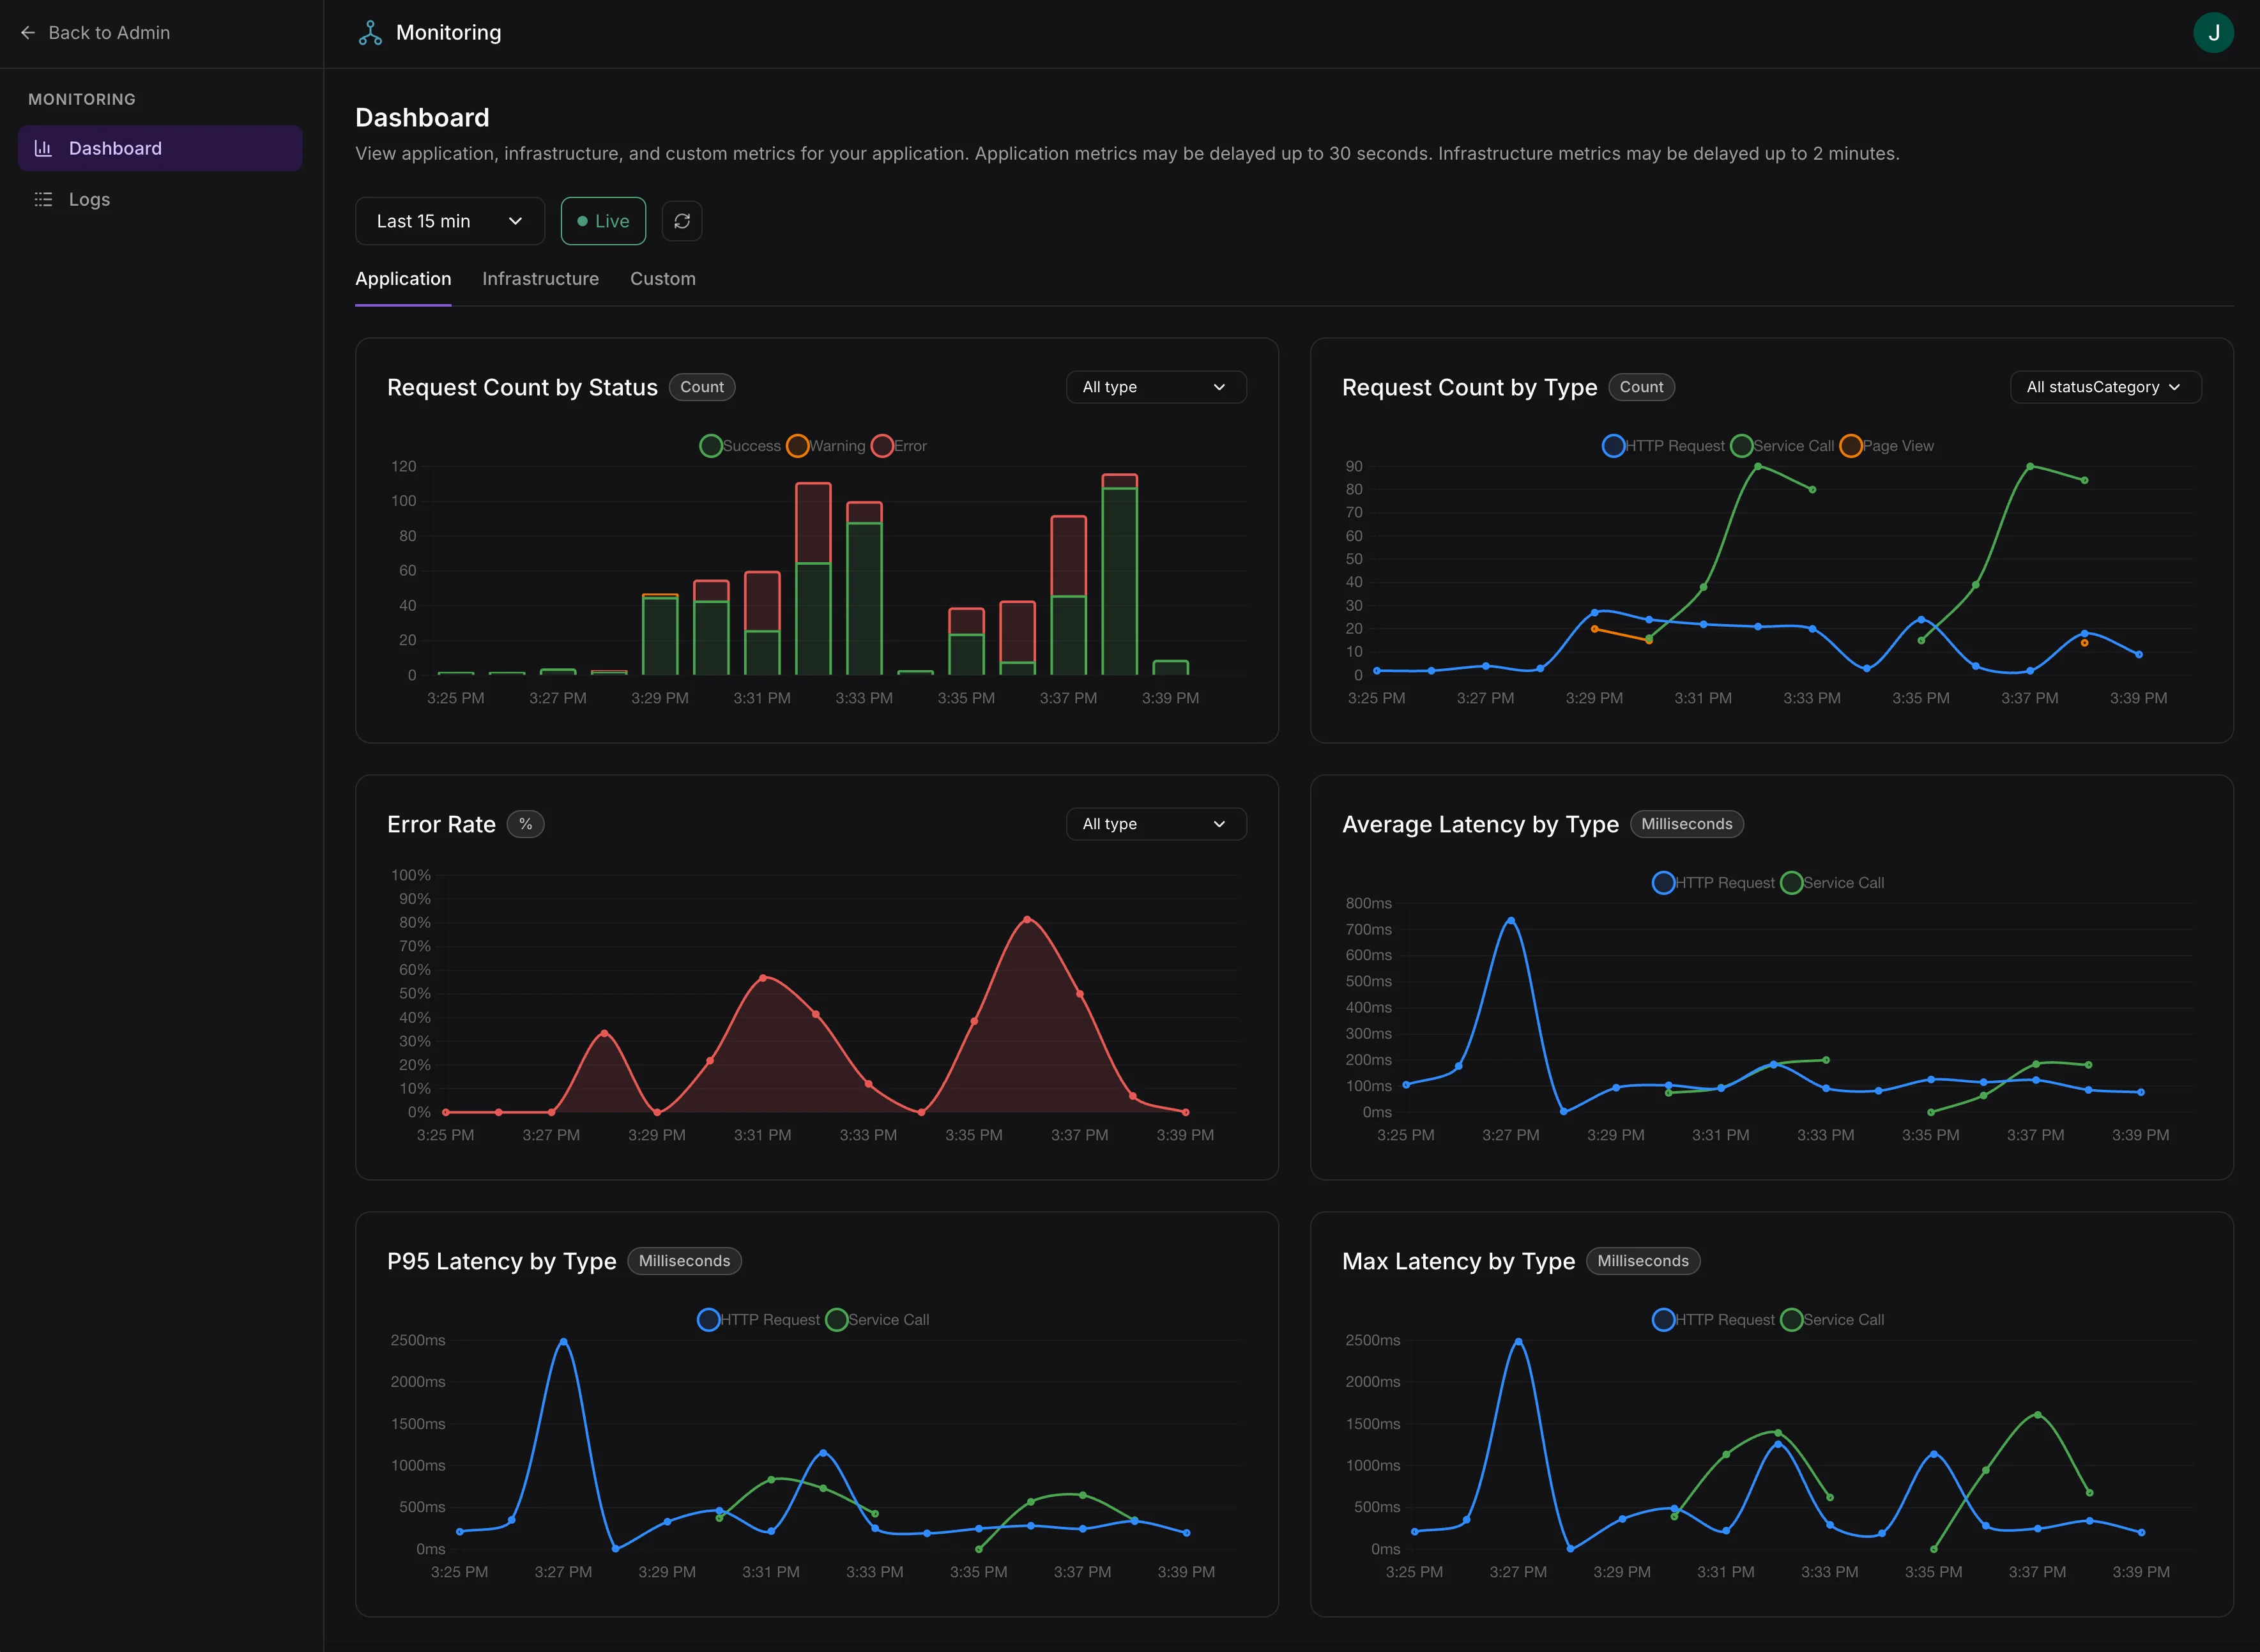 Access requires the `logs:view` scope. Assign this scope to admin roles in your app's access control configuration.
### Dashboard features
* **Live charts** with automatic refresh
* **Time range selection**: 5 min, 15 min, 1 hr, 6 hr, 24 hr, or custom range
* **Application tab**: Request volume, latency distribution, error rates, worker demand vs. capacity
* **Infrastructure tab**: CPU utilization, memory utilization, instance scaling
* **Dimension drill-down**: Split any metric by status category, request type, or other dimensions
* **Computed metrics**: Error rate percentages, capacity utilization transforms
* **Crosshair synchronization**: Hover over one chart to highlight the same timestamp across all charts
* **Overlay metrics**: Plot multiple metrics on the same chart for correlation
Application metrics may be delayed up to 1 minute. Infrastructure metrics may be delayed up to 2 minutes.
Access requires the `logs:view` scope. Assign this scope to admin roles in your app's access control configuration.
### Dashboard features
* **Live charts** with automatic refresh
* **Time range selection**: 5 min, 15 min, 1 hr, 6 hr, 24 hr, or custom range
* **Application tab**: Request volume, latency distribution, error rates, worker demand vs. capacity
* **Infrastructure tab**: CPU utilization, memory utilization, instance scaling
* **Dimension drill-down**: Split any metric by status category, request type, or other dimensions
* **Computed metrics**: Error rate percentages, capacity utilization transforms
* **Crosshair synchronization**: Hover over one chart to highlight the same timestamp across all charts
* **Overlay metrics**: Plot multiple metrics on the same chart for correlation
Application metrics may be delayed up to 1 minute. Infrastructure metrics may be delayed up to 2 minutes.