See Which Customers Will Churn Before They Do
Build unified engagement views on Synthetiq across every data source. Custom health scoring, risk classification, and scenario modeling, all from live data. Connect your sources and start getting answers in the same session.
Customer Data Everywhere. Customer Insight Nowhere.
Engagement data scattered across your product database, CRM, Elasticsearch, and spreadsheets. The "Customer 360" vision keeps getting delayed by competing priorities. Health scores built manually in Excel every quarter can't keep pace with real-time churn signals.

What Teams Build
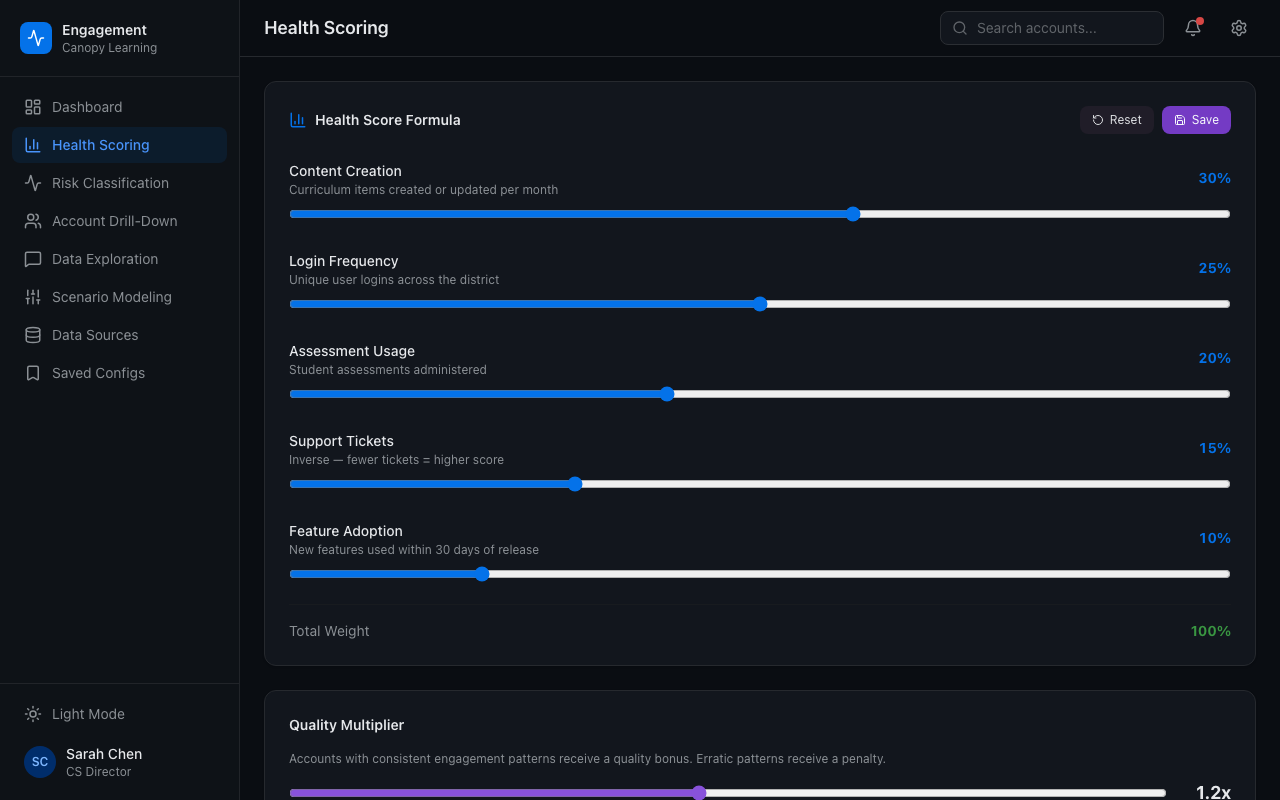
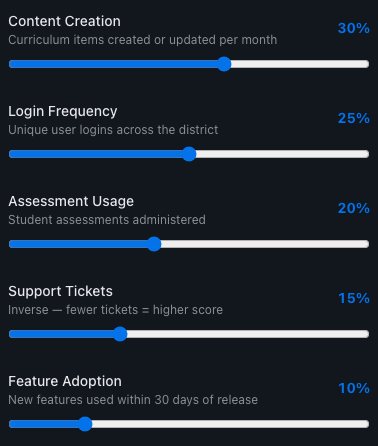
Custom Health Scoring
Define what "engaged" means for your product. Weight content creation, logins, purchases, and support tickets differently. Configurable formulas with quality multipliers, not a vendor's generic score.
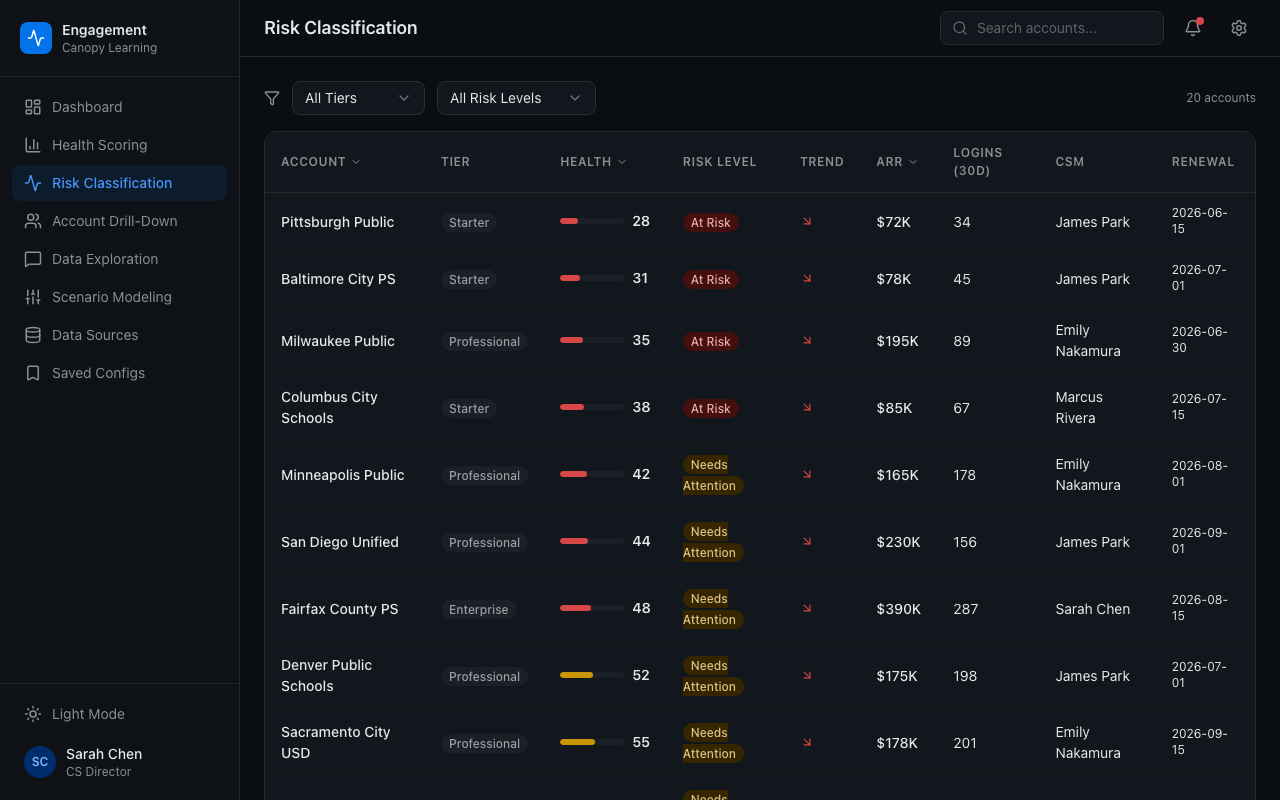
Risk Classification
Automatically classify accounts as Highly Engaged, Active, Needs Attention, or At Risk. Surface declining engagement weeks before churn signals appear in your CS platform.
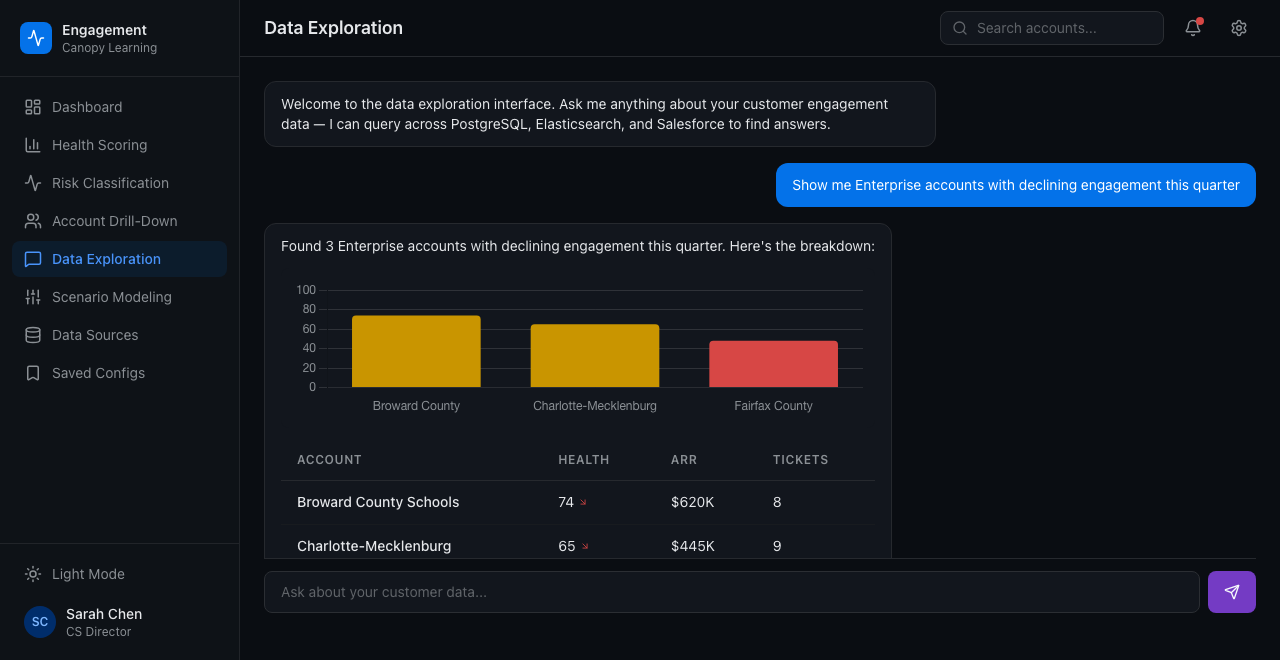
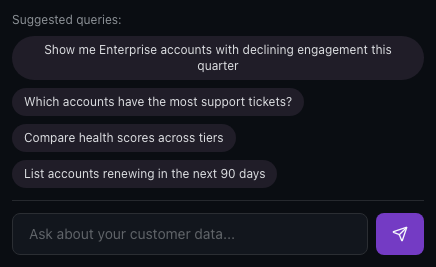
Natural Language Data Exploration
"Show me Enterprise accounts with declining engagement this quarter." The AI queries Elasticsearch, SQL, or APIs directly, then visualizes the results. No query language needed. Explore data directly.
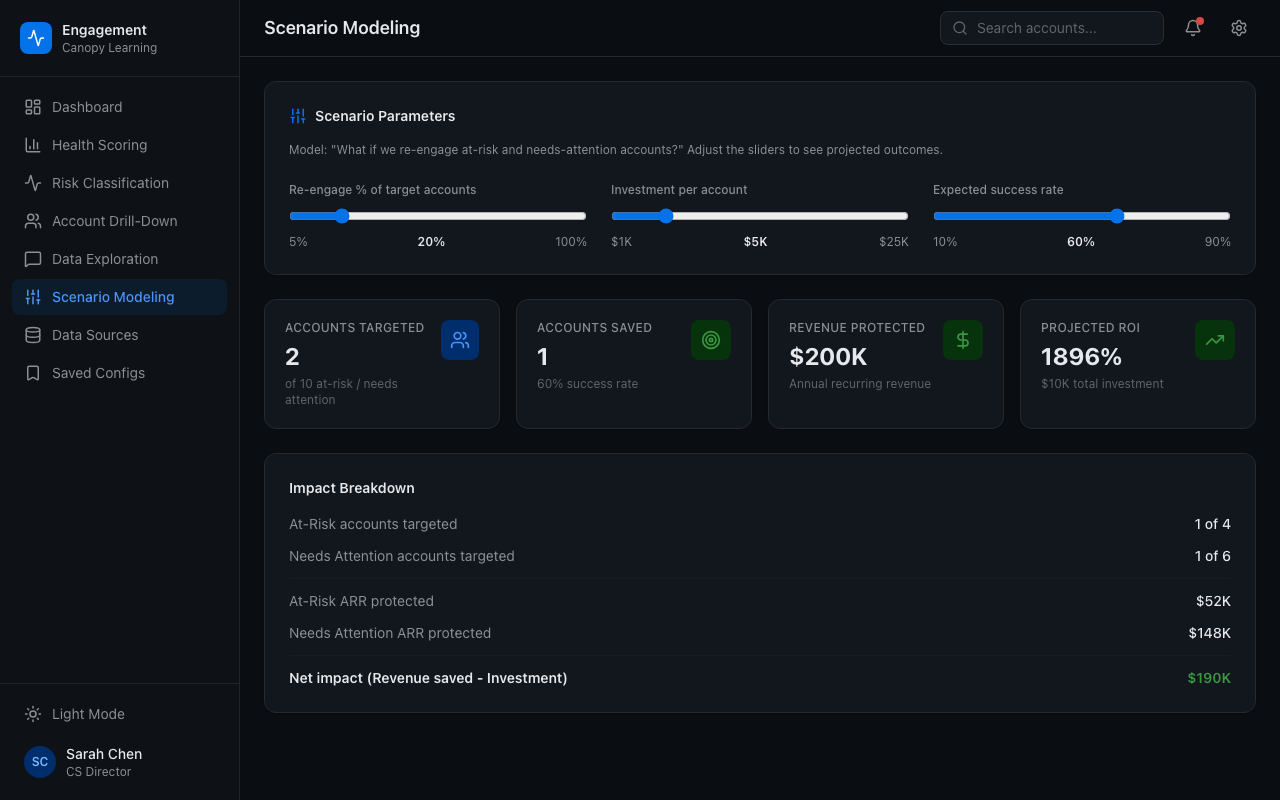
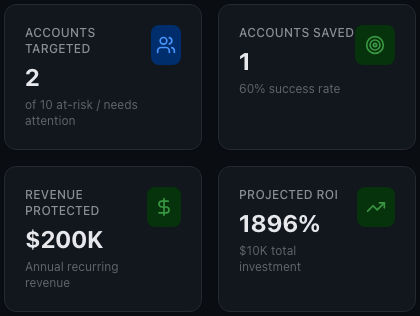
Scenario Modeling
"What if we re-engage 20% of at-risk accounts?" Model retention lift, revenue impact, and resource cost before committing budget. Justify the intervention with projected ROI.
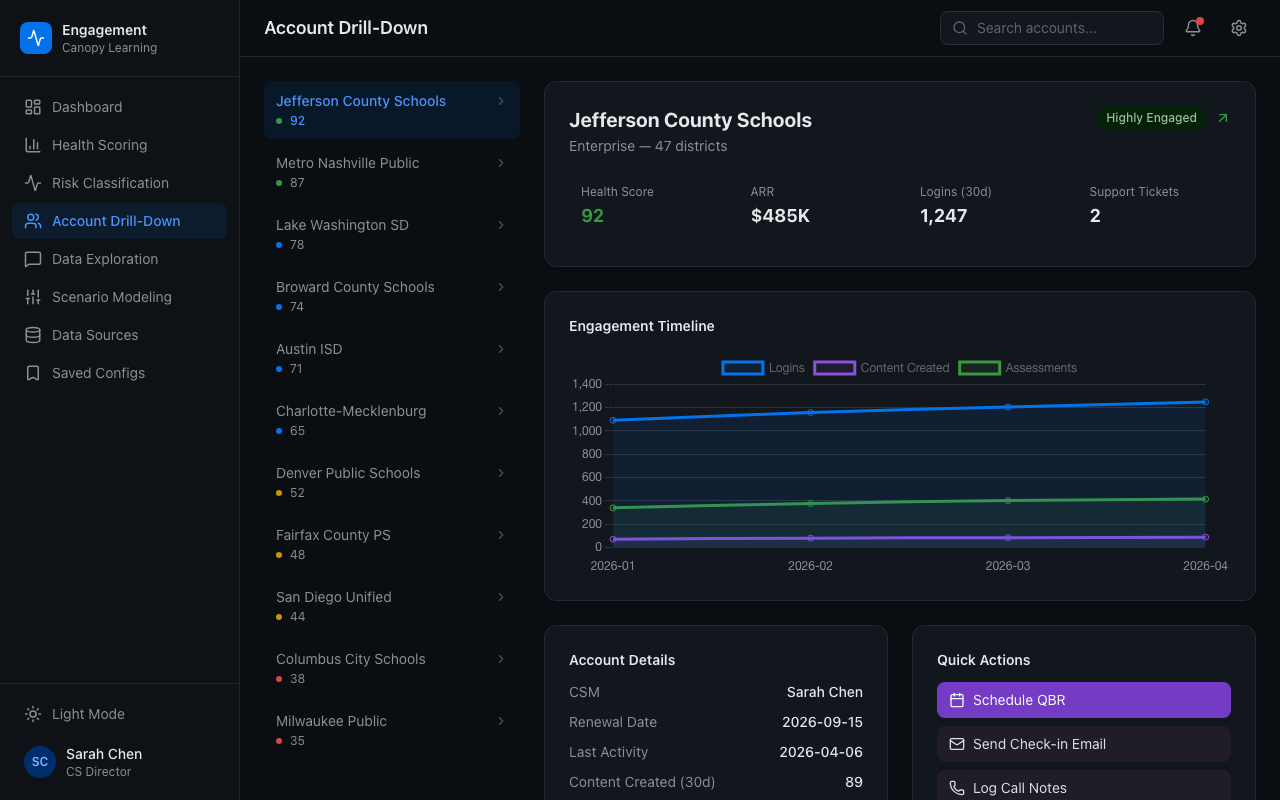
Per-Account Drill-Down
Click any account to see the full engagement timeline, risk trajectory, usage breakdown, and activity trends. From portfolio view to individual account in one click.
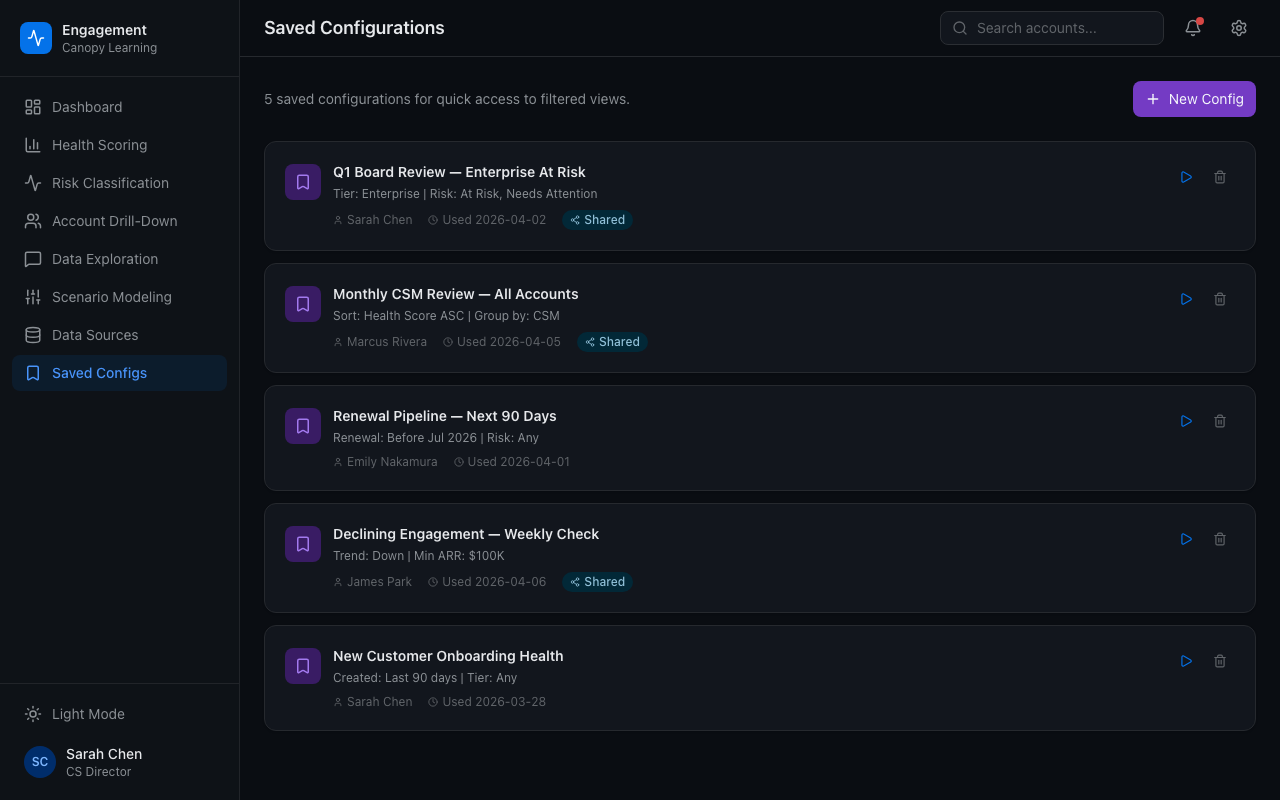
Saved Configurations
Save filter combinations for quarterly business reviews, board decks, or specific customer segments. One click to reproduce any analysis exactly as you ran it last time.
What Teams Build
Custom Health Scoring
Define what "engaged" means for your product. Weight content creation, logins, purchases, and support tickets differently. Configurable formulas with quality multipliers, not a vendor's generic score.
Risk Classification
Automatically classify accounts as Highly Engaged, Active, Needs Attention, or At Risk. Surface declining engagement weeks before churn signals appear in your CS platform.
Natural Language Data Exploration
"Show me Enterprise accounts with declining engagement this quarter." The AI queries Elasticsearch, SQL, or APIs directly, then visualizes the results. No query language needed. Explore data directly.
Scenario Modeling
"What if we re-engage 20% of at-risk accounts?" Model retention lift, revenue impact, and resource cost before committing budget. Justify the intervention with projected ROI.
Per-Account Drill-Down
Click any account to see the full engagement timeline, risk trajectory, usage breakdown, and activity trends. From portfolio view to individual account in one click.
Saved Configurations
Save filter combinations for quarterly business reviews, board decks, or specific customer segments. One click to reproduce any analysis exactly as you ran it last time.
From Scattered Data to Retention Strategy
Connect Your Data Sources
Point at your product database, Elasticsearch cluster, or CRM API. Direct connections to live data.
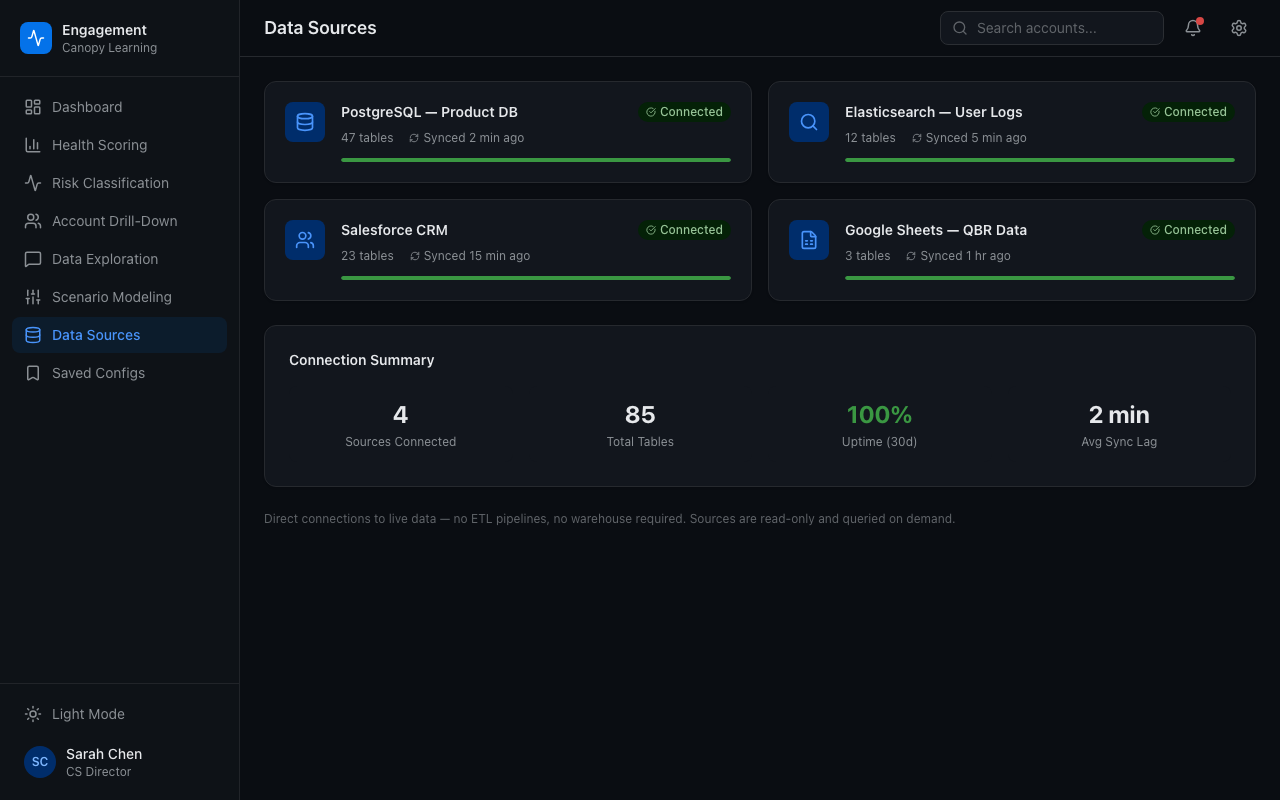
Connect Your Data Sources
Point at your product database, Elasticsearch cluster, or CRM API. Direct connections to live data.
Define Your Health Model
Configure scoring weights and risk thresholds that match your retention strategy. The AI helps calibrate based on your historical data patterns.
Define Your Health Model
Configure scoring weights and risk thresholds that match your retention strategy. The AI helps calibrate based on your historical data patterns.
Ask Questions, Get Answers
"Which cohort has the highest churn risk?" "How does Enterprise engagement compare to SMB?" Charts, tables, and insights in seconds.
Ask Questions, Get Answers
"Which cohort has the highest churn risk?" "How does Enterprise engagement compare to SMB?" Charts, tables, and insights in seconds.
Act Before It's Too Late
Export at-risk account lists. Model intervention ROI. Share dashboards with stakeholders. Turn insight into action while there's still time to save the account.
Act Before It's Too Late
Export at-risk account lists. Model intervention ROI. Share dashboards with stakeholders. Turn insight into action while there's still time to save the account.
Start Saving Customers Before They Leave
See how Synthetiq builds engagement views from your data sources. We'll help you configure health scoring and risk models in your first working session.
Request a Demo