Application metrics
Apps automatically collect and publish the following metrics every 30 seconds:
Metrics are dimensioned by:
type: HTTP Request, Service Call, Page ViewstatusCategory: Success (2xx–3xx), Warning (4xx), Error (5xx)
Infrastructure metrics
In addition to application-level metrics, the following infrastructure metrics are collected by the cloud provider approximately every 60 seconds:Custom metrics
Apps can be instrumented with custom metrics to track application-specific data (see Custom Metrics guide). Custom metrics are published in the same manner as application metrics — collected every 30 seconds and isolated per app.Database metrics
Database metrics are coming soon. In the interim, BYOI users can monitor database metrics directly through their cloud provider’s native tools.Metrics dashboard
Each app ships with a metrics dashboard accessible at: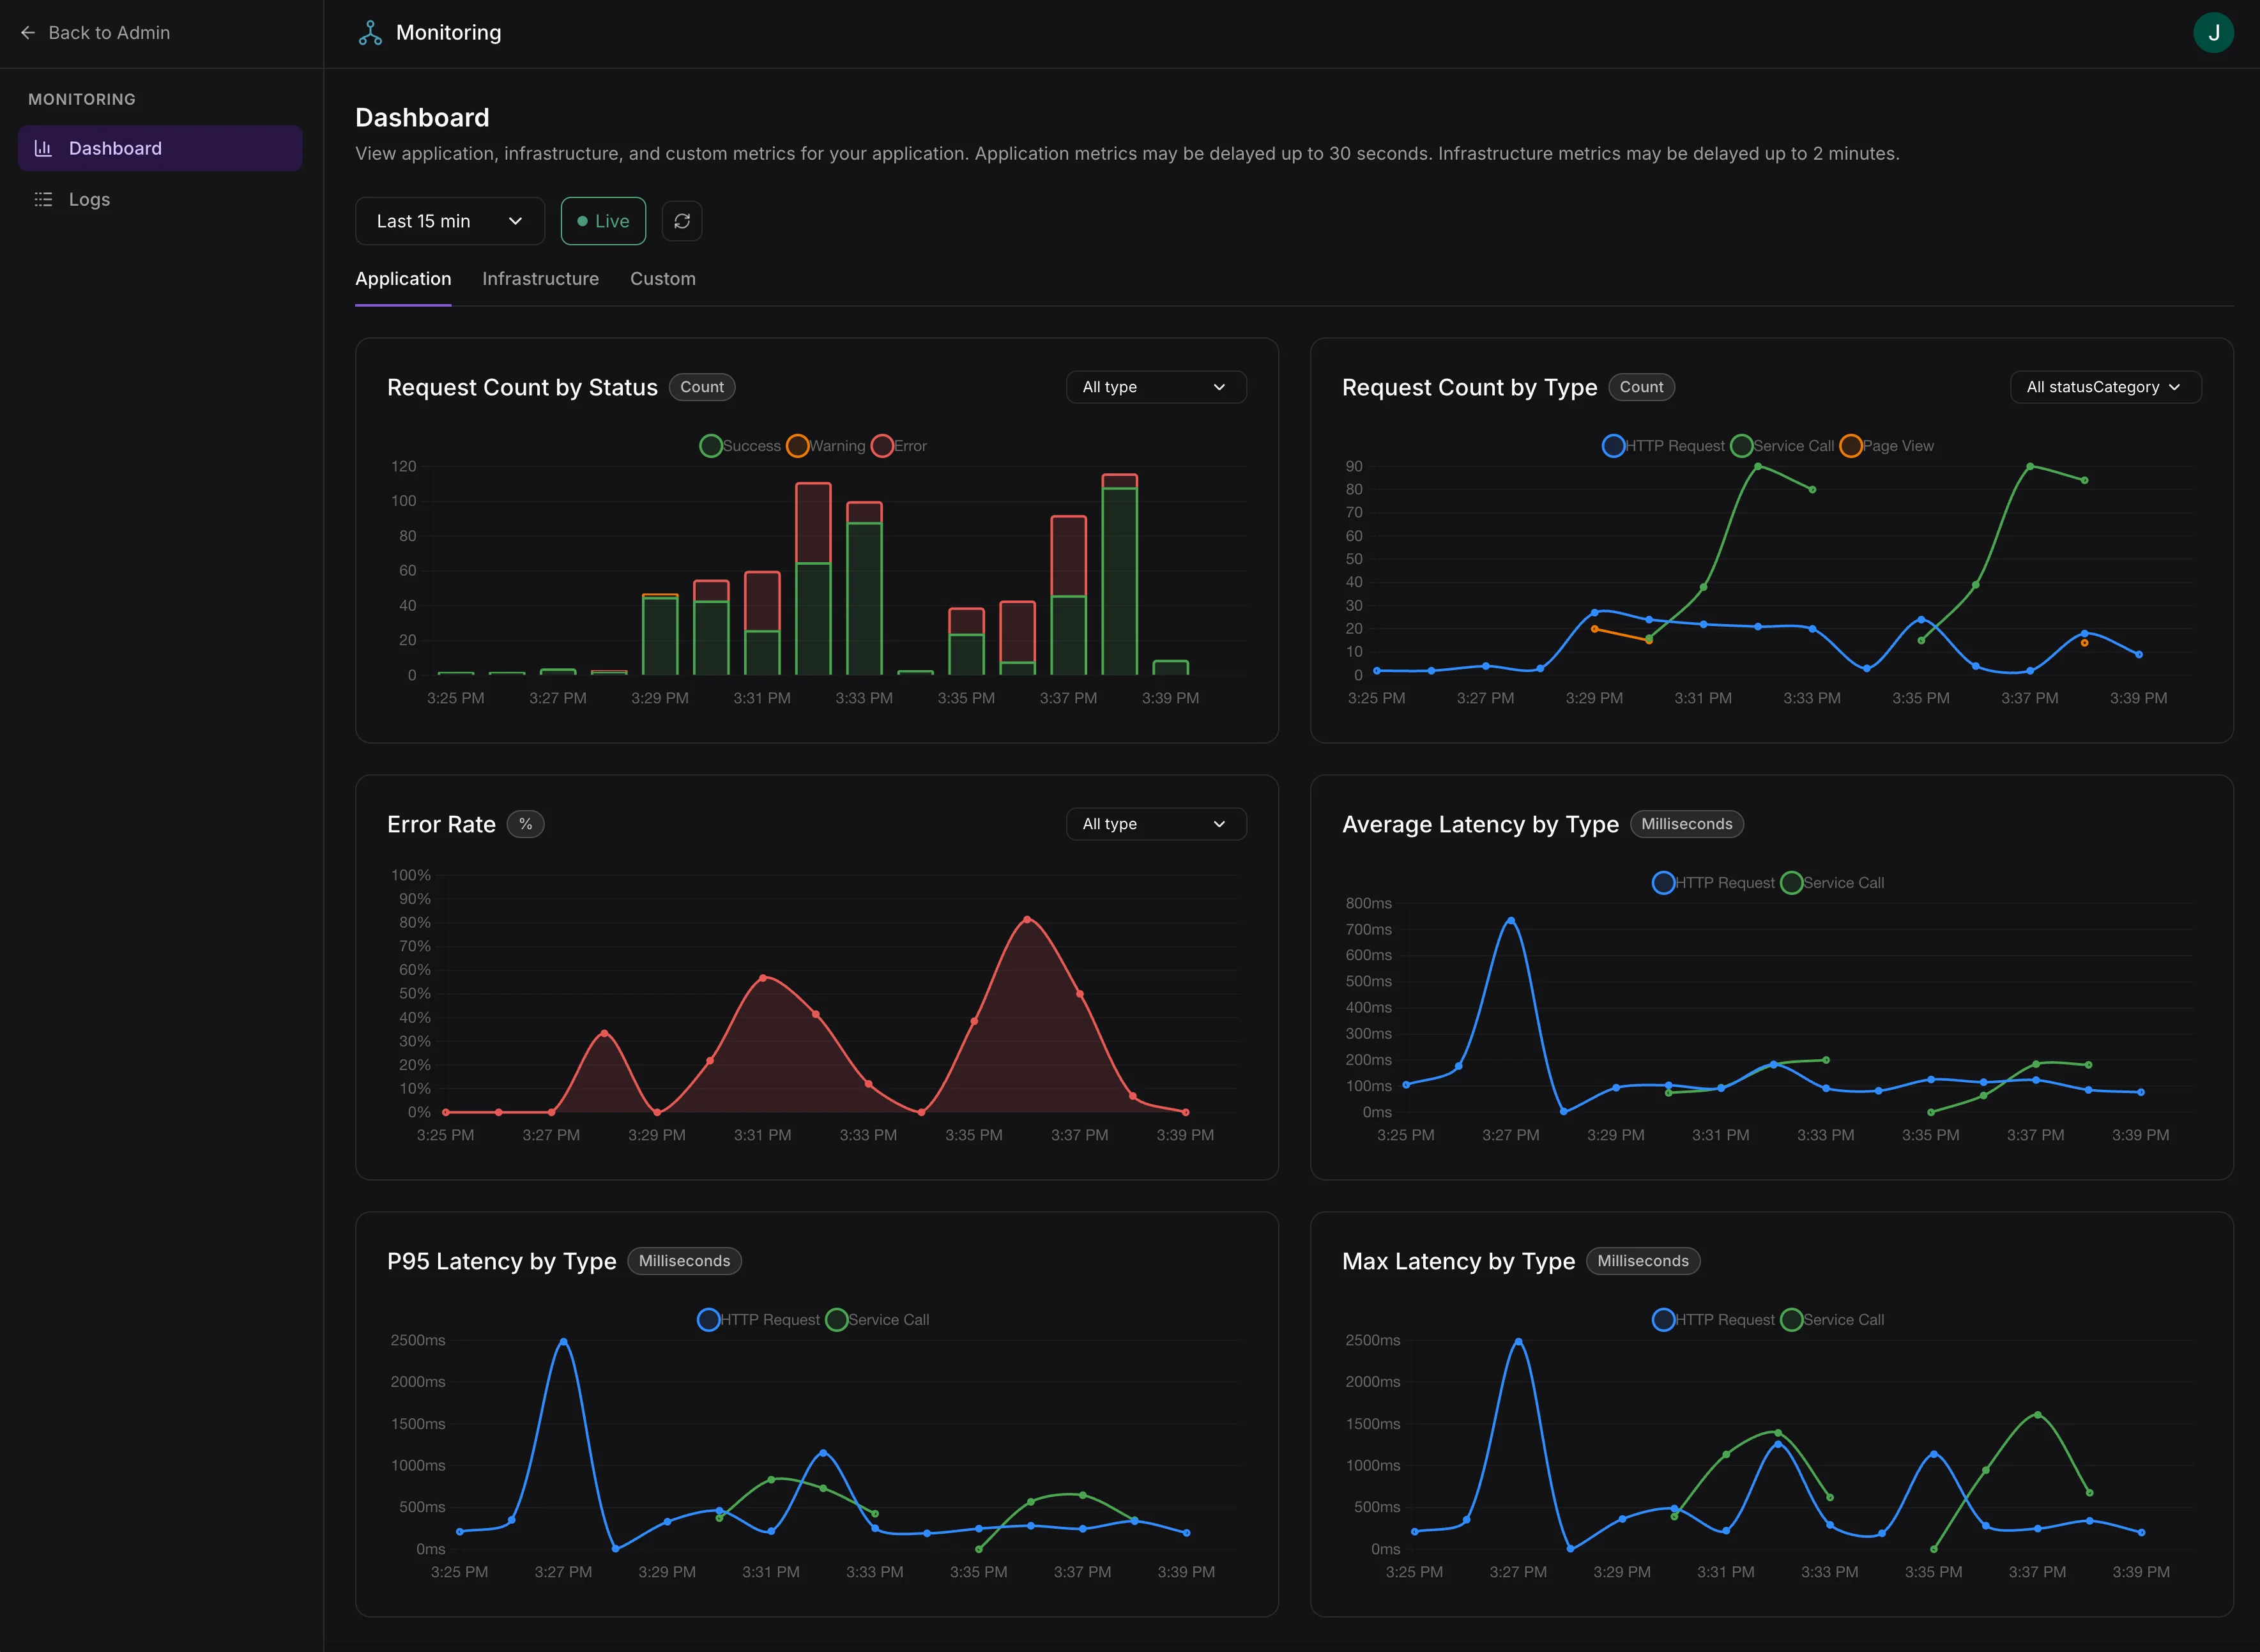
Built-in metrics dashboard with application, infrastructure, and custom metrics tabs
Access requires the
logs:view scope. Assign this scope to admin roles in your app’s access control configuration.Dashboard features
- Live charts with automatic refresh
- Time range selection: 5 min, 15 min, 1 hr, 6 hr, 24 hr, or custom range
- Application tab: Request volume, latency distribution, error rates, worker demand vs. capacity
- Infrastructure tab: CPU utilization, memory utilization, instance scaling
- Dimension drill-down: Split any metric by status category, request type, or other dimensions
- Computed metrics: Error rate percentages, capacity utilization transforms
- Crosshair synchronization: Hover over one chart to highlight the same timestamp across all charts
- Overlay metrics: Plot multiple metrics on the same chart for correlation
Application metrics may be delayed up to 1 minute. Infrastructure metrics may be delayed up to 2 minutes.