

Pick the environment and the last hour, 24 hours or 7 days. Unhealthy apps sort first with the reason, then healthy, then no status, each group by error rate and then traffic. The sidebar shows a badge while any app is down or failing.
Top errors
Top errors groups each app’s 5xx errors from the last hour with a count. It’s read in the same run as health, so the two always match. Select an error to open Logs for that app, searched for it.One app’s charts
An app’s live charts show error rate and latency plus its worker, load balancer and database, over any time range you choose.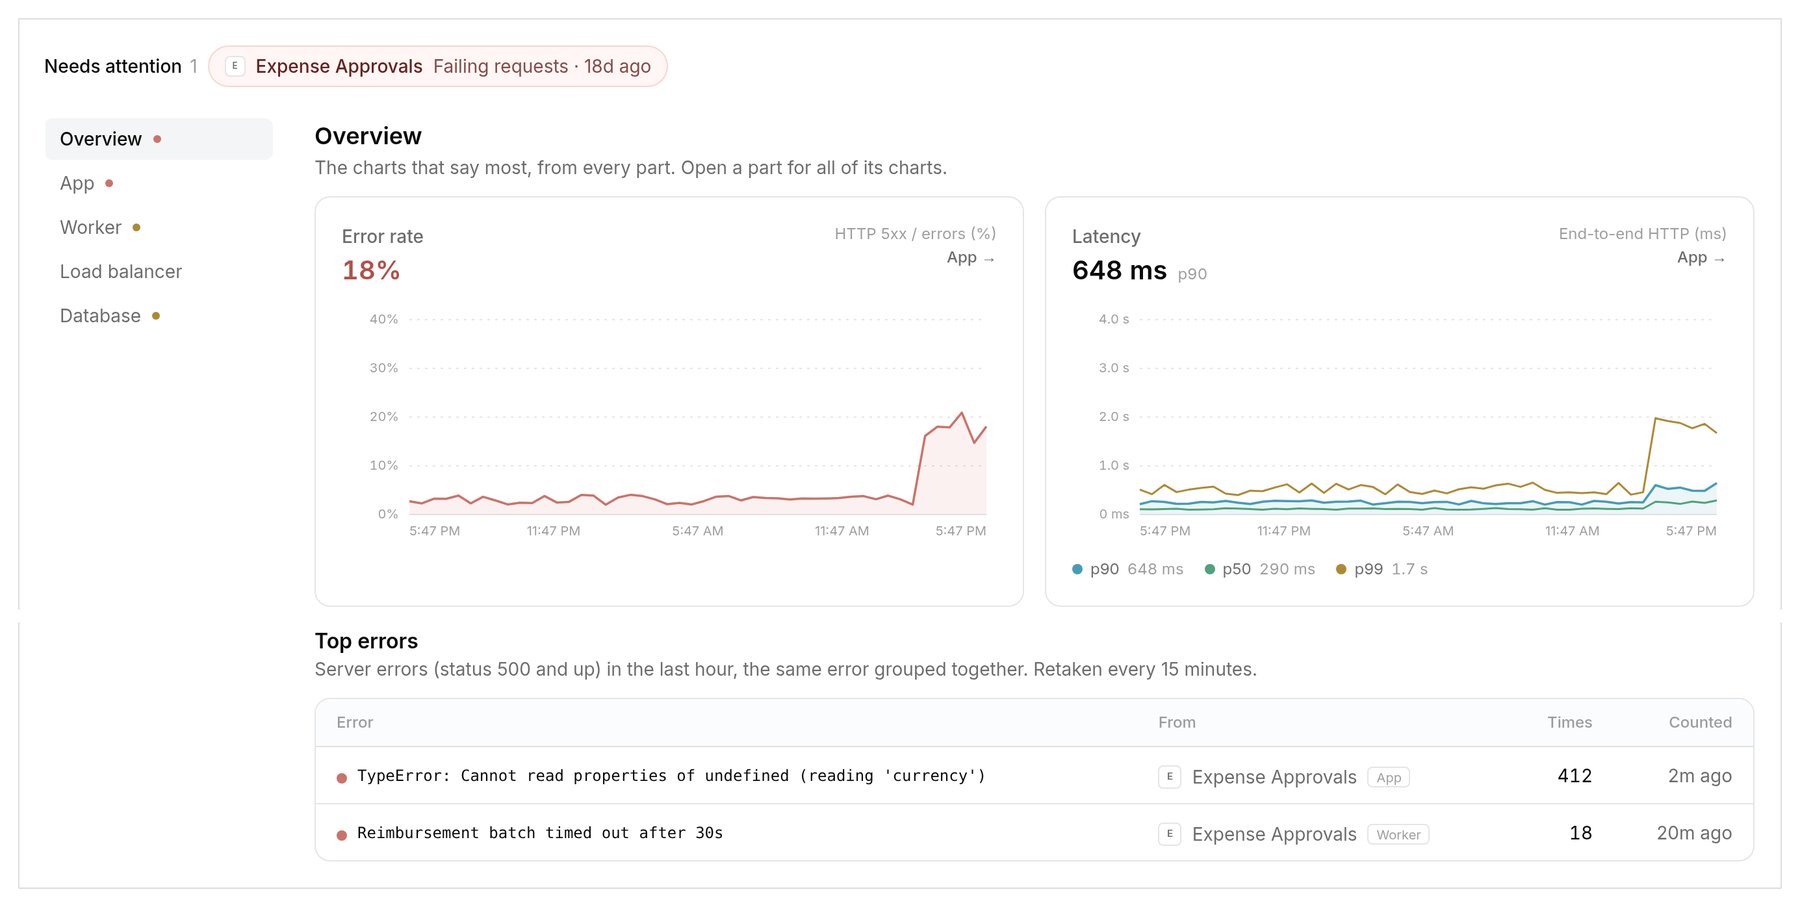
One app during an error spike: error rate, latency and top errors.